2023 P5 Report
The next decade of U.S. particle physics, laid out for every reader
- Year
- 2023–present
- Role
- Design and development
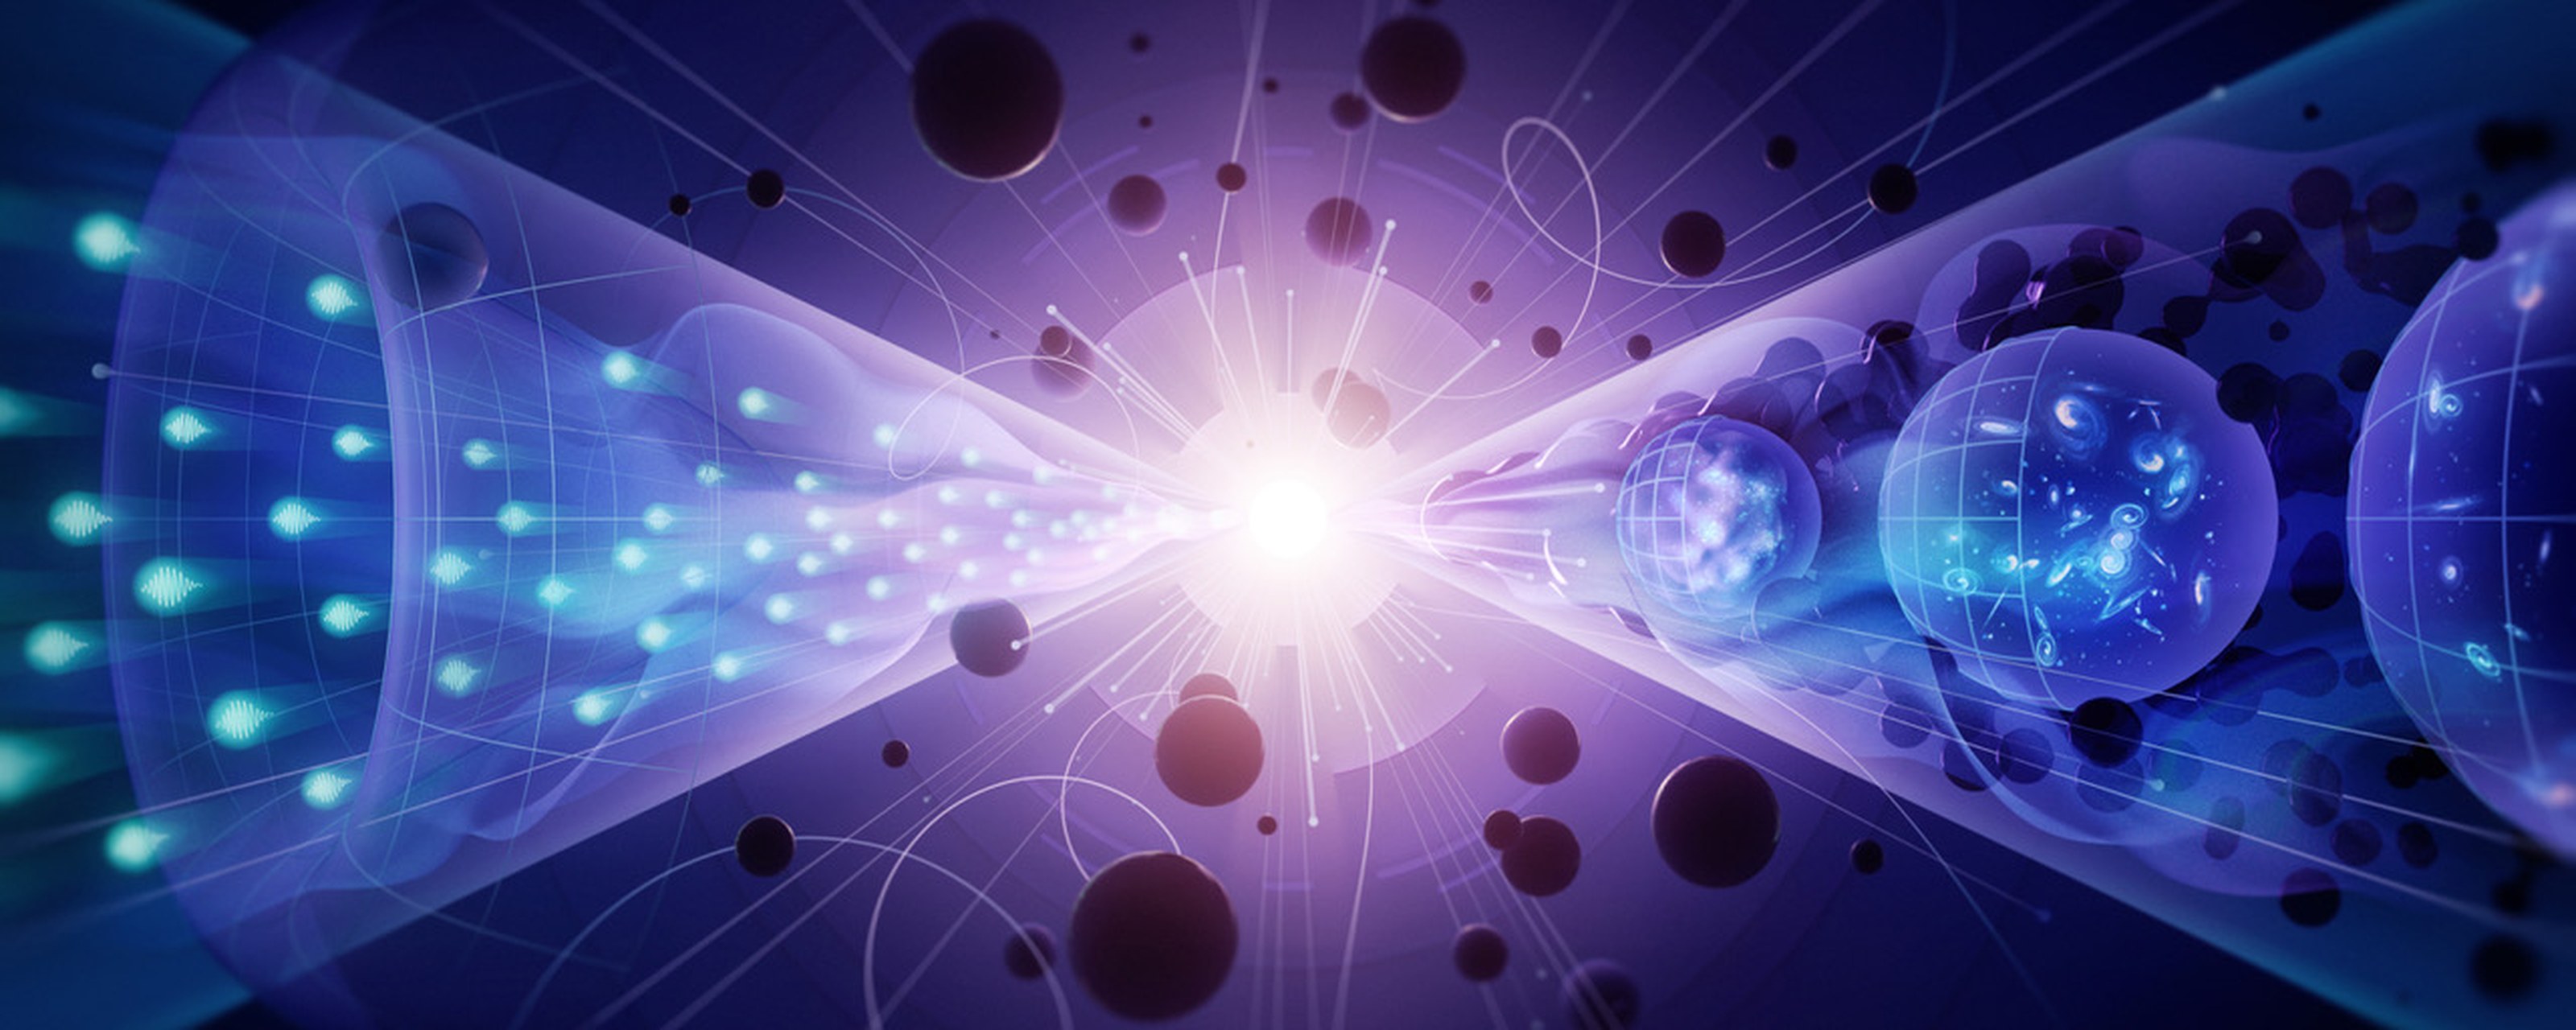
Once a decade, U.S. particle physics sets out its plan for the next 10 years. The 2023 report, ‘Exploring the Quantum Universe,’ lays out the field’s priorities within a 20-year global vision and two budget scenarios. It went public on December 7, 2023. The New York Times carried the road map on its science page within hours, Nature and Science within a day, all three sent readers to the online edition.
P5, the Particle Physics Project Prioritization Panel, commissioned Sandbox to produce the report in print and online. We worked with the panel’s scientists on the creative direction, the original artwork, and the production of both editions. I designed and developed the online edition, and had it ready for the release.
The result
The release drove the report’s biggest month. In December 2023, as the recommendations moved through the news, its pages drew 22,035 views. Readers kept coming after the news moved on: of 74,879 views since launch, more than two-thirds came later. Nearly three years on, the online edition is still the report’s public home.
The online edition
The report is long and technical: an executive summary, 8 chapters, a full list of recommendations, and an appendix. It serves two audiences at once: the agencies that fund the field, and the research community settling on its shared priorities. Readers arrive with different destinations in mind, so the site had to get each of them there quickly.
The menu opens onto every chapter and every download in a single view. Search finds a term anywhere in the report and shows each match with its section heading and the sentences around it. The chapters run long, so choosing a result scrolls straight to the match, not the top of the page.
Original illustration anchors the three science drivers the report is built around. The online edition mirrors the print report, and the downloads let readers work from the document directly.
Hero illustration: Olena Shmahalo
Spot illustrations: Abigail Malate
Responsive timeline and the budget table
Two figures sit at the center of the report. Figure 1 lays out the recommended program on a timeline from 2024 to 2034, with each experiment’s construction, operation, and R&D phases, alongside a matrix of which science drivers each one serves. Figure 2 maps the same projects against their construction cost and their fate under three budget scenarios.
In print they’re large, dense figures, and tables that size are hard to carry onto a screen: squeeze the columns to fit and nothing is readable. I built them as responsive infographics instead. Wide tables scroll sideways with their labels pinned in the first column, so they keep every column. On phones, where even a scroll gets too tight, each table turns into a list.
Recognition
Beyond the press, the funding agency, the national laboratories the plan turns on, and the universities that helped draft it marked the report on their own channels.


Building a muon collider could restore America’s leadership in particle physics, according to the P5 committee in their recent report. The report provides recommendations to @ENERGY & @NSF for future research in particle physics, as reported @nytimes

“Fermilab strongly and enthusiastically supports the #P5report in its entirety. The 2023 P5 report provides an ambitious, bold and balanced vision and roadmap for U.S. high-energy physics.” — Fermilab Director Lia Merminga

The 2023 P5 report represents the major activity in the field of particle physics that delivers recommendations to U.S. funding agencies.

“The P5 report shows that we’re on track, and we’re excited for the future of the field.” The future of particle physics research has been defined by the @Energy approved P5 Report. @Physics_CMU professor Rachel Mandelbaum helped draft the report.

Check out an insightful article by our Division Director, Cameron Geddes, for @APSPhysics on how recommendations from the 2023 P5 Report are set to drive advancements in #ParticleAccelerator science and applications.
